|
|
Plotting a large data set is difficult if it does not fit into memory as a data frame, so we introduce more efficient data structures and alternative plot functions that work with large data.
The idea of this project is simply to create plottable data structures that are more storage efficient than the data frames which are the standard inputs to lattice/ggplot2 plot functions.
There are 2 ideas I am currently exploring in this project. Plotting directly from an external database system, and plotting based on a list of arrays. Let's see an example of how an array list can work to plot the same data set more efficiently.
install.packages("alplot",repos="http://r-forge.r-project.org")
library(alplot)
data(BodyWeight,package="nlme")
attach(BodyWeight)
al <-
  arraylist(weight=t(narray(weight,Time,Rat)),
            time=narray(unique(Time),Time),
            Diet=narray(factor(Diet[Time==1]),Rat))
detach(BodyWeight)
excess <- as.numeric(object.size(BodyWeight)/object.size(al))
print(excess)
[1] 2.936364
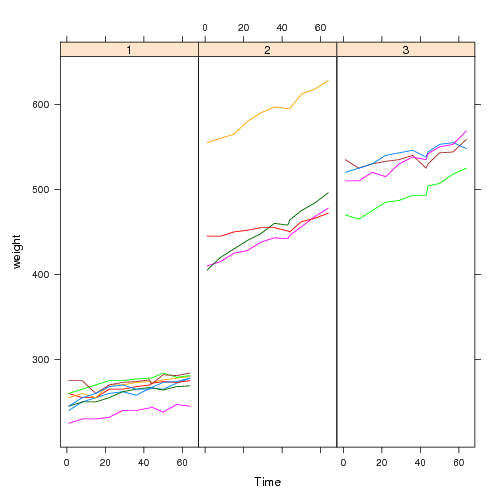
It takes a bit of manual work to convert the data frame to the correct array list format that is required to plot, but the end result is that the same data take up 3 times less space. Since all the information is preserved, we can still plot it using lattice and the plot method for arraylist objects:
xyplot(weight~Time|Diet,BodyWeight,groups=Rat,type="l",layout=c(3,1))
plot(al,weight~time|Diet,groups=Rat,type="l",layout=c(3,1))
The basic idea behind the arraylist plot method is that we construct a minimal dummy data frame for passing as input to the usual xyplot function. Then, for each call to panel.groups, we bring the real data into memory to plot.
This idea can be extended to use ff arrays or an external sql database system, instead of array lists. These options have the potential to be even less taxing on R's memory usage.
The project summary page you can find here.